- Metabolomics approaches
- General introduction
- Metabolic Fingerprinting
- Targeted Metabolomics
- Processing methods
-------------
- Quick Tutorial
- 1- Data preparation phase
- 2- View the spectra
- 3 - Interactive data processing
- 4 - Spectra Processing
- 5 - Bucketing
- 6 - Data Export
- 7 - Restore a session
- 8 - Batch mode execution
-------------
-------------
- Other information
- Firewall/Antivirus Issues
- Changelog
- Events
- Stats
- PDF online
-------------
![]()
Targeted Metabolomics
This refers to quantitative approaches wherein a set of known metabolites are quantitated. The identities of metabolites have been initially established based on the available databases and using standard compounds. The identified metabolite peaks are then quantified based on internal or external reference compounds. Here, we suggest two references as good reviews that could be read with great profit:
- Santosh Kumar Bharti, Raja Roy (2012) Quantitative 1H NMR, spectroscopy, Trends in Analytical Chemistry 35:5-26, doi:10.1016/j.trac.2012.02.007
- Patrick Giraudeau, Illa Tea, Gérald S. Remaud, Serge Akoka (2014) Reference and normalization methods: Essential tools
for the intercomparison of NMR spectra, Journal of Pharmaceutical and Biomedical Analysis 93:3–16, doi:10.1016/j.trac.2012.02.007
In this case the identity of the metabolites of interest is established before statistical data analysis, and this involves to be able:
- to identify the ppm areas for which the quantification will be performed based on both knowledge and well-established metabolomic profiles,
- to ensure that each of these areas is not polluted by the neighbor areas
To fulfill these two points, it is necessary to locally correct the baseline in order to i) eliminate the residual effects due to the presence of macromolecules in extracts, ii) but also reduce the prevalence of a high intense peak on the less intense ones.
Example of local baseline correction for quantifying compounds via 1H NMR
To quantify target compounds, a simple and efficient method is to fit the lineshape applied on a signal portion of those compounds. These signal portions are chosen such that they are not or little affected (ie in a smoothly way) by a possible overlap with a neighboring peak. In the figure below, the two targeted compounds (asparagine and aspartate) exhibit each of them a doublet whose only their lineshape are affects by the trailing signal of a high intensity nearby lorentizian.

Typical approach for quantifying compounds via 1H NMR
A typical approach for quantifying compounds via 1H NMR is based on Calibration-curve method (i.e. external reference optionaly coupled with an internal reference such as ERETIC). For more explanation and details, see the reference given above.
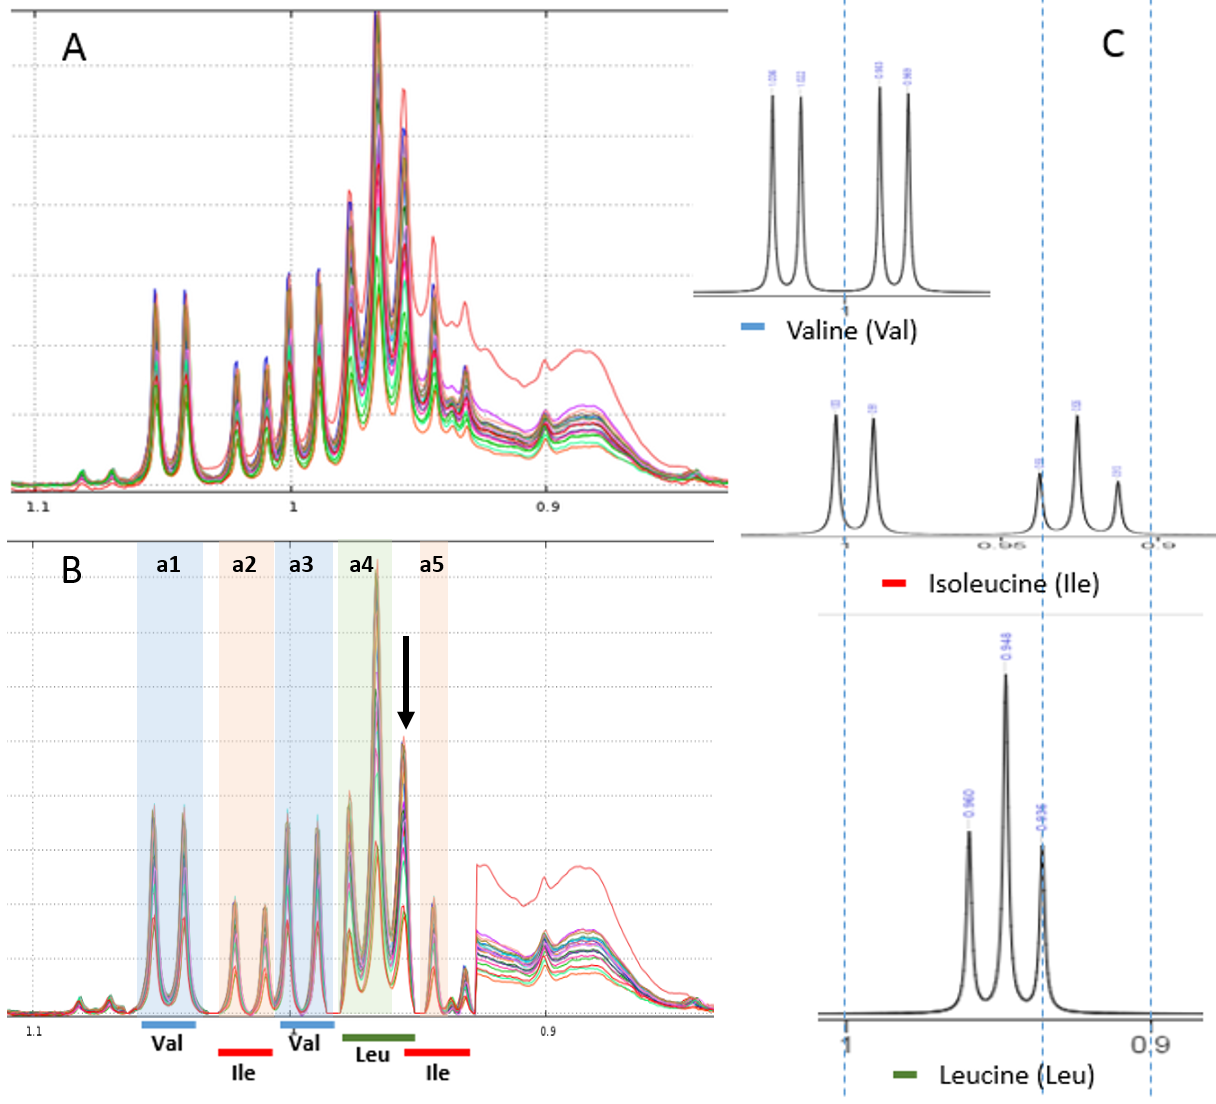 |
The figure shows a ppm area where are located 3 amino acids (valine, leucine and isoleucine), (A) before any local baseline correction, and (B) after local baseline correction ('q-NMR' type) in NMRProcFlow, (C) The 1H NMR reference patterns for each of these amino acids are shown for this ppm area. The colored areas (one color per compound) correspond to the areas from which the quantification will be done. The peak highlighted by the arrow is left aside because it is the sum of 2 amino acids, namely Leu+Ile. In order to check the quality of the baseline correction, the graphs below show the correlation between 2 buckets belonging to the same compound, before and after the baseline correction. 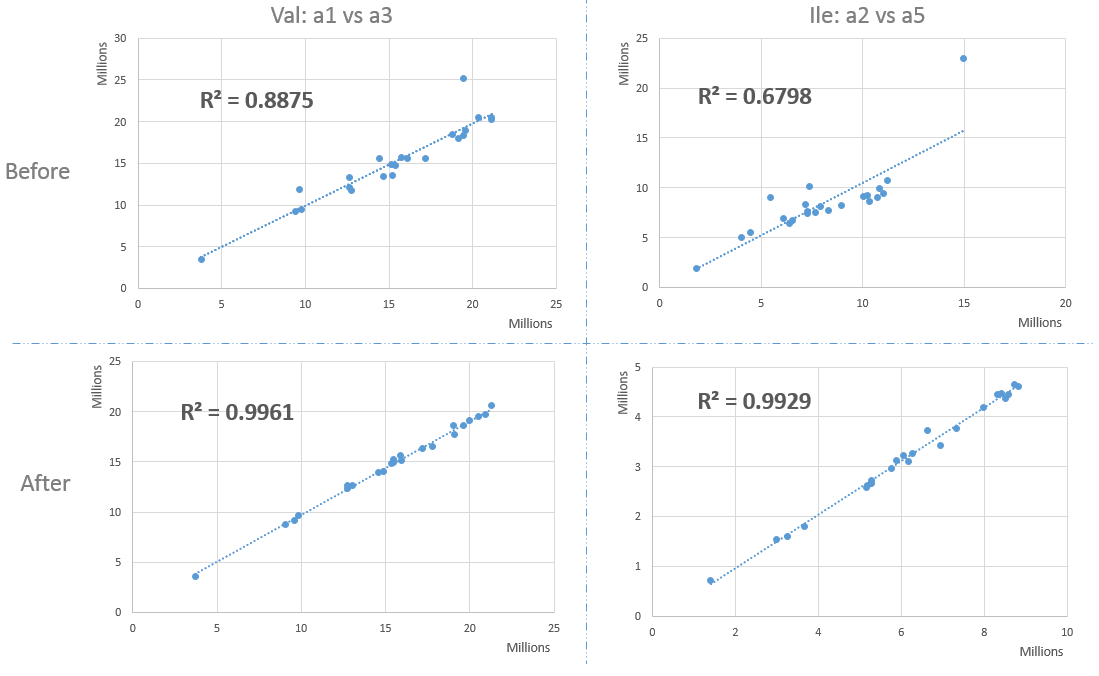 |
After the processing and bucketing steps, NMRProcFlow allows users to export all data needed for the quantification in a same XLSX workbook. Two workbook templates were currently available: A simple one and a template dedicated for the quantification.
- The simple template just aggregates the buckets table, the SNR matrix and the data matrix, each data type being within a separate tab.
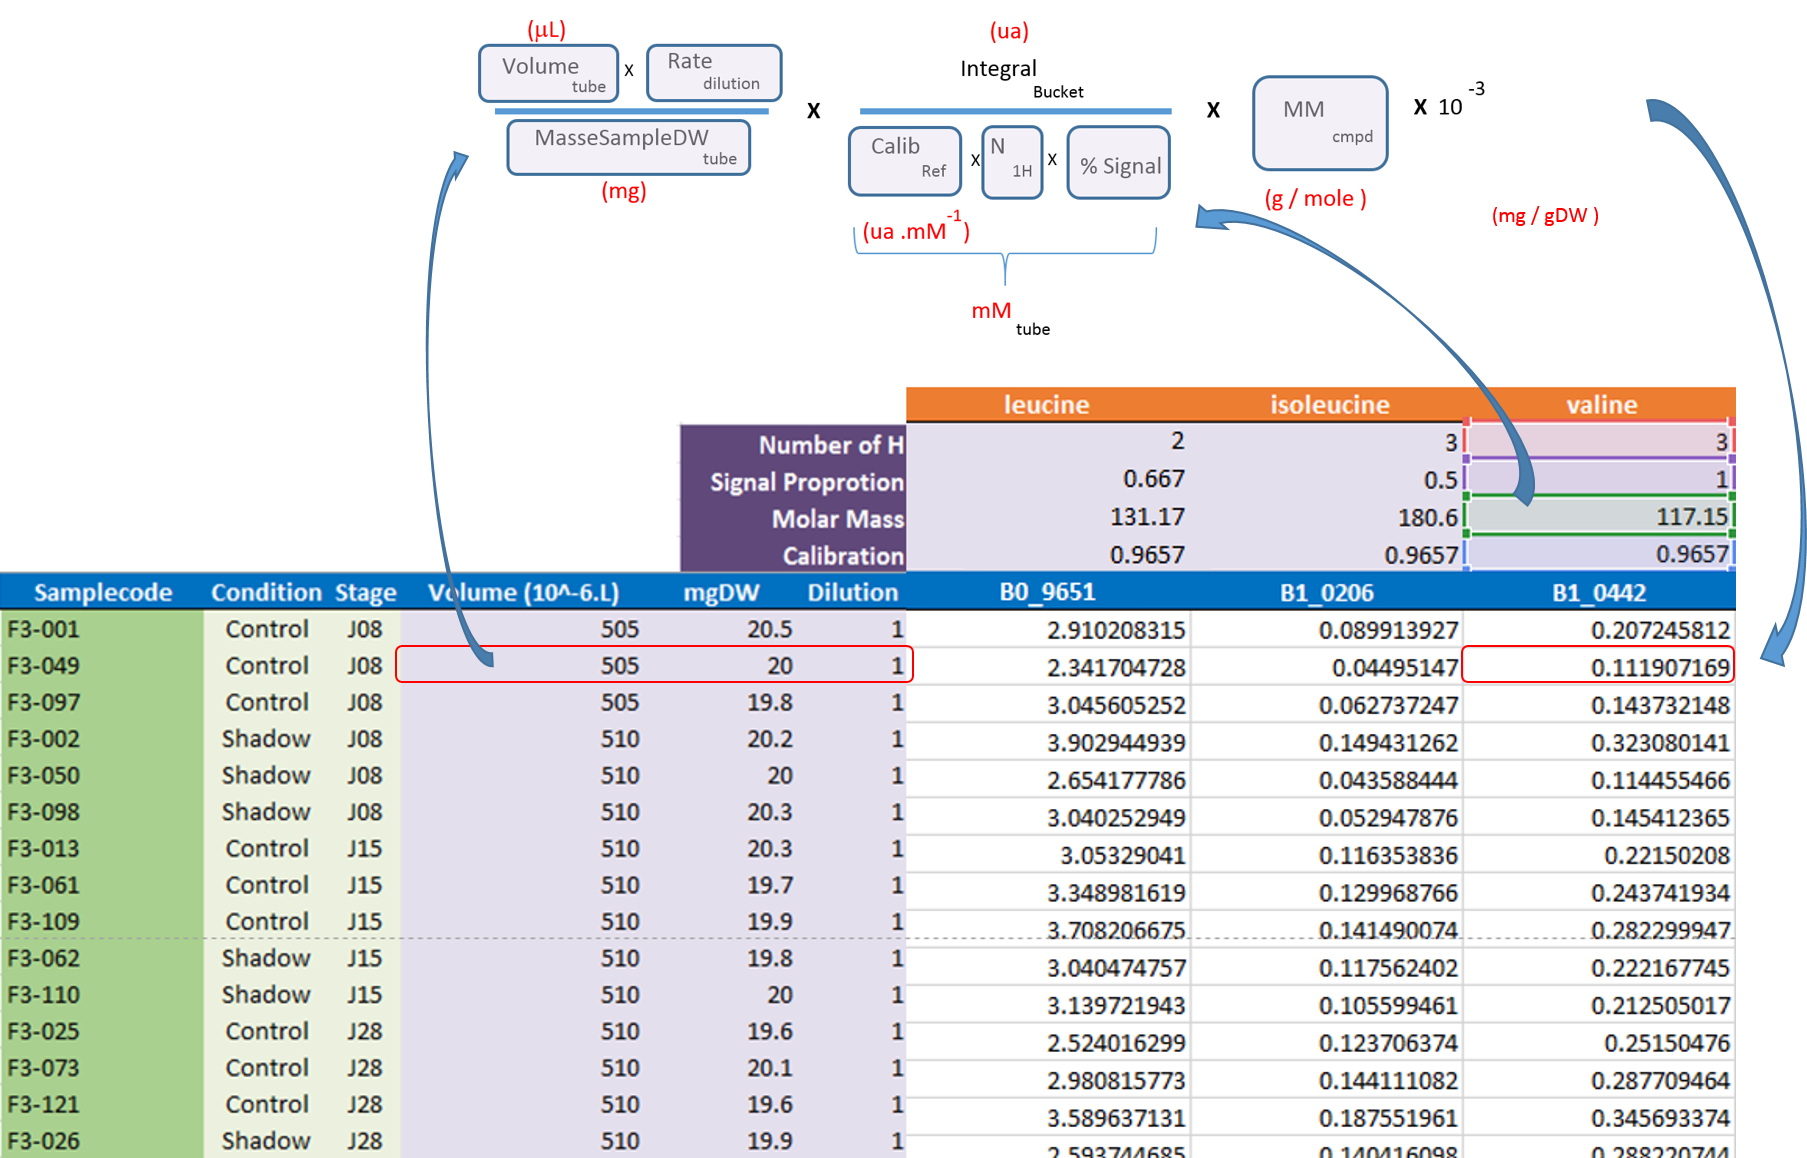
- The 'qHNMR' template, in the same way as the simple template aggregates information like the samples table, the buckets table, the SNR matrix and the data matrix within separate tabs, but also includes another tab with the pre-calculated quantications according to a formula from data provided in the others tabs. Some information are set by default in both 'samples' and 'buckets' tabs. Just adjust them with the appropriate values and the quantifications within the eponymous tab will be automatically updated as depicted in the figure below:
See online some slides about the targeted approach along with NMRProcFlow: Targeted metabolomics