- Metabolomics approaches
- General introduction
- Metabolic Fingerprinting
- Targeted Metabolomics
- Processing methods
-------------
- Quick Tutorial
- 1- Data preparation phase
- 2- View the spectra
- 3 - Interactive data processing
- 4 - Spectra Processing
- 5 - Bucketing
- 6 - Data Export
- 7 - Restore a session
- 8 - Batch mode execution
-------------
-------------
- Other information
- Firewall/Antivirus Issues
- Changelog
- Events
- Stats
- PDF online
-------------
![]()
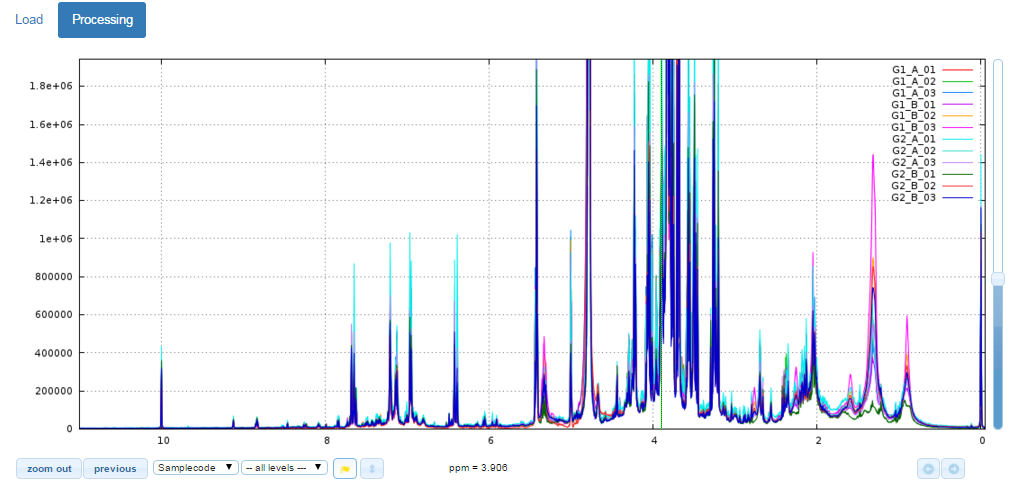
View the spectra
The NMR spectra viewer is the central tool of NMRProcFlow and the core of the application. It allows the user:
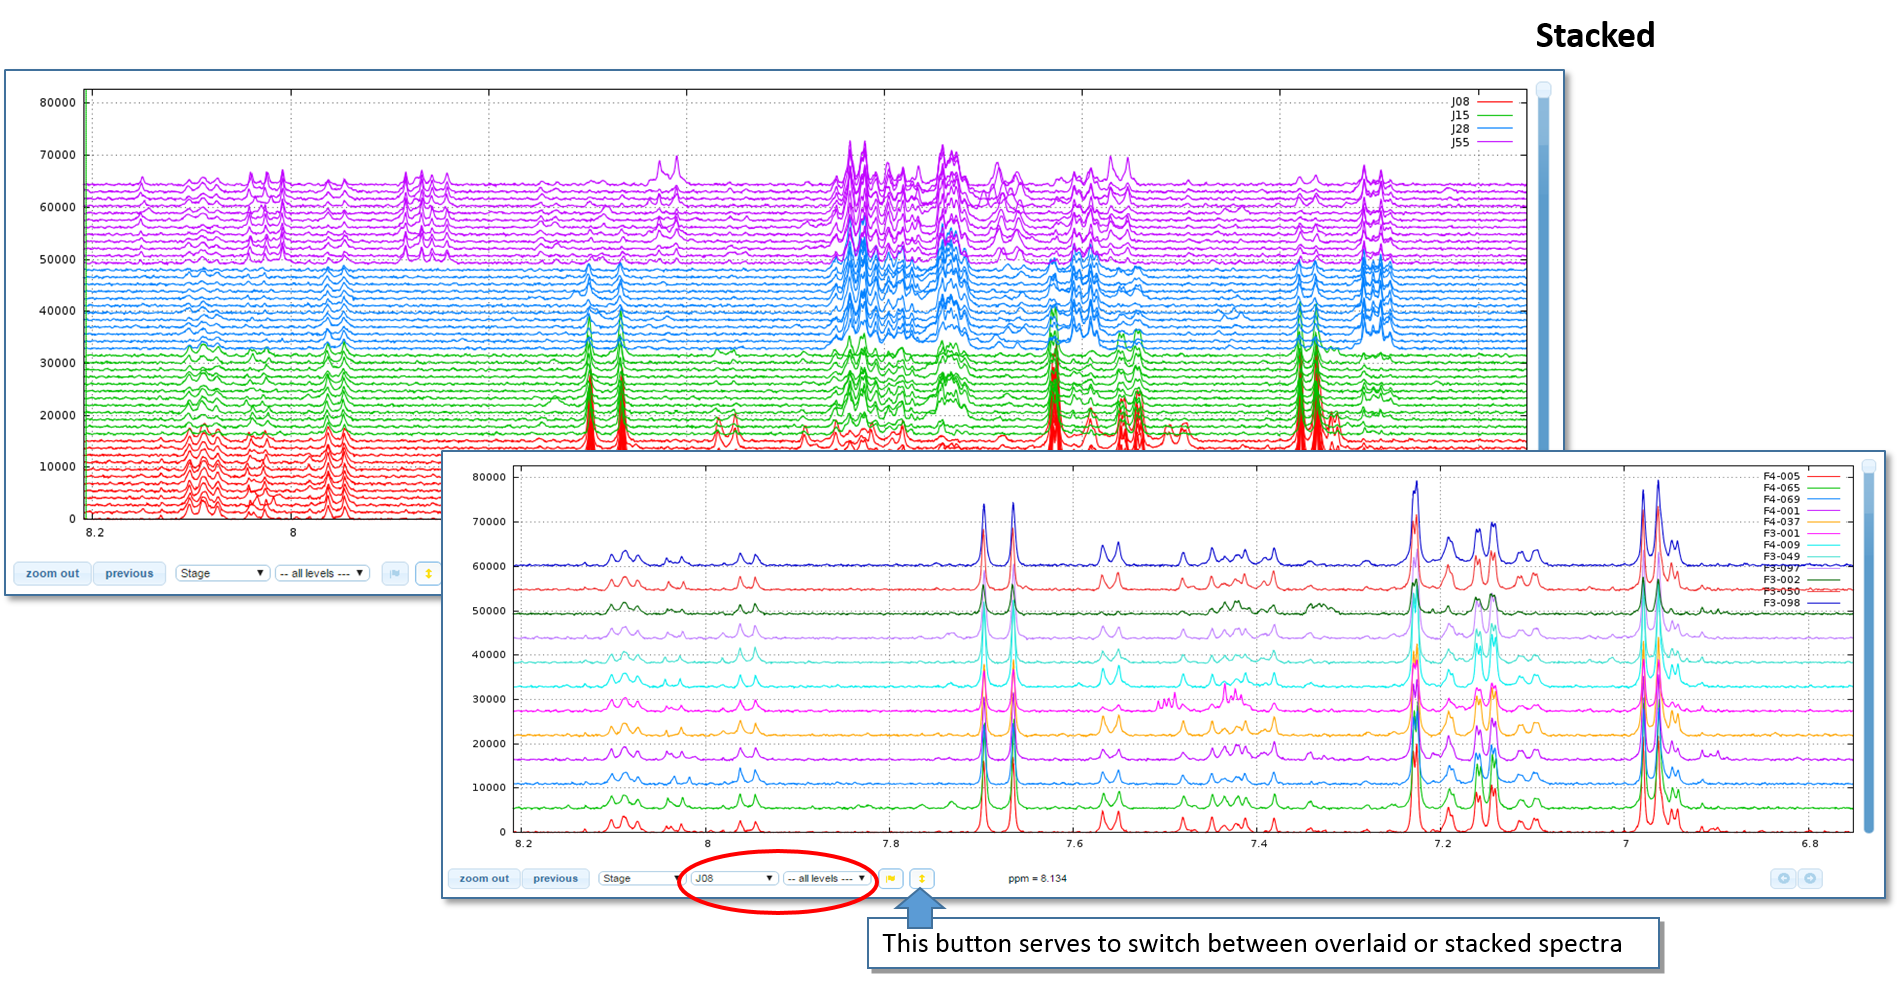
- To visually explore the spectra either overlaid or stacked,
- To zoom in for intensity and/or ppm scales,
- To color each subset of spectra according to their corresponding factor levels
- To capture a ppm range using the mouse to stick it in the suitable input box in order to process this ppm range
Test online the NMR Spectra Viewer
Because the NMR spectra viewer is the central tool of NMRProcFlow it occupies more than half of the window.
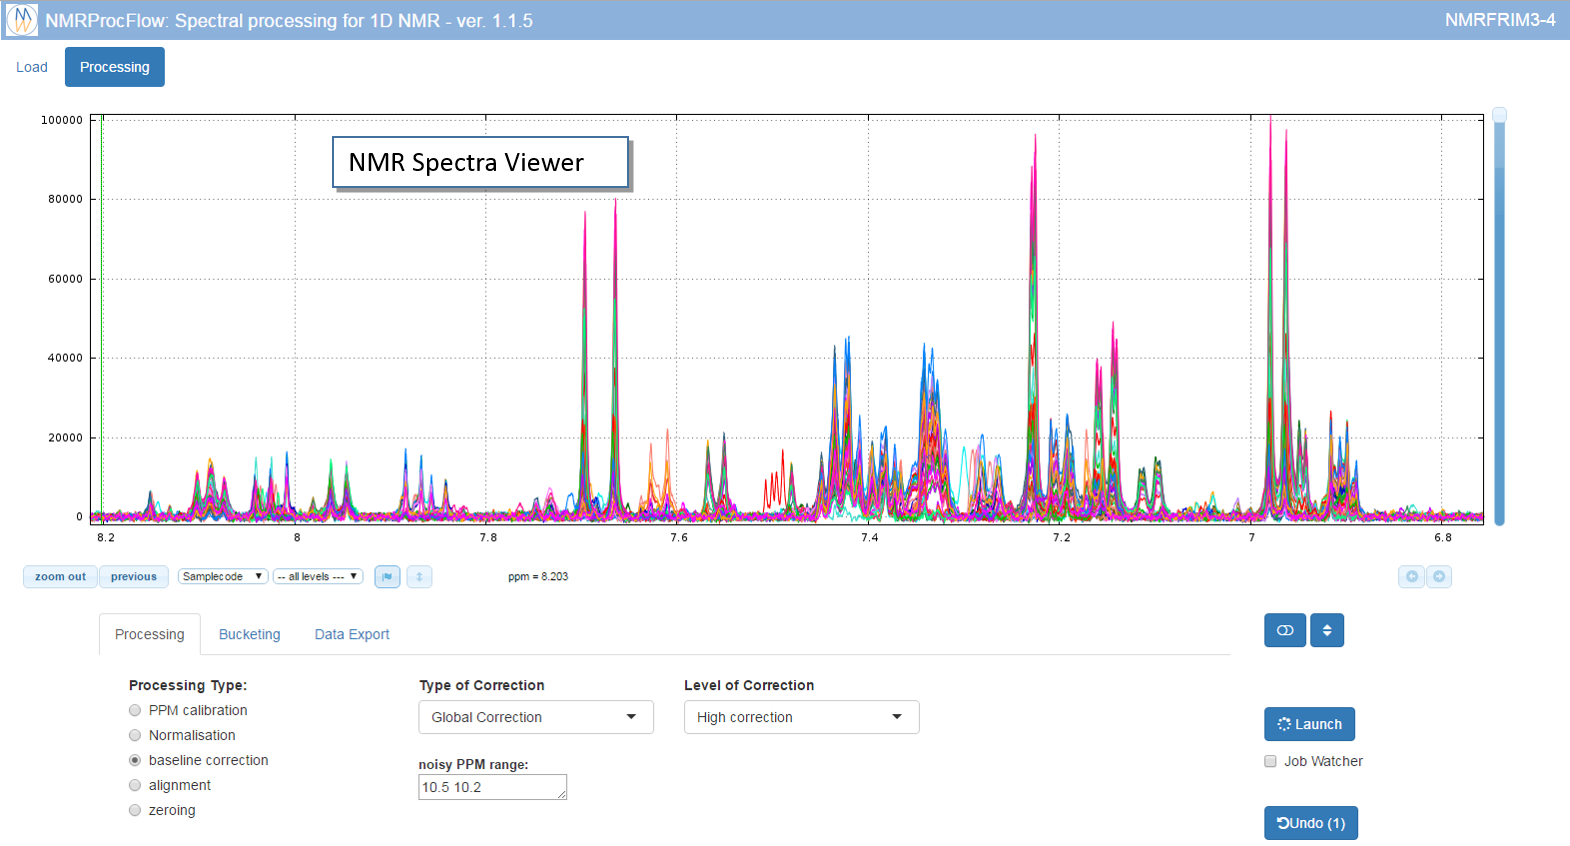
Tip: For a better view and according to your screen resolution, think about slightly reduce the zoom of your web browser (e.g. 90%)
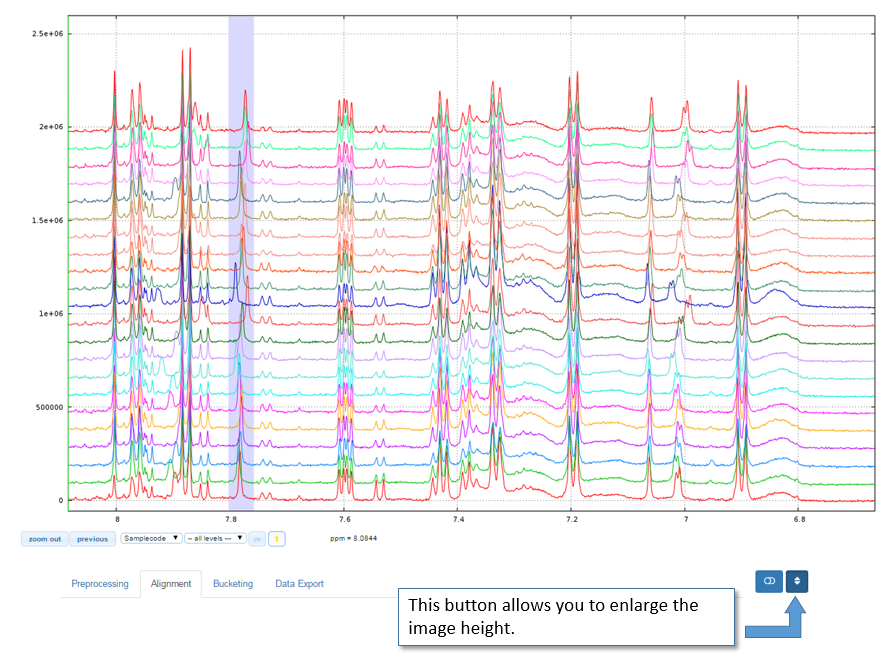
Overlay / Stack and Spectra Colors

Enlarge the image height